Category:Maps of weather and climate in the 20th century
Jump to navigation
Jump to search
Subcategories
This category has the following 16 subcategories, out of 16 total.
1
- Eliofania (MeteoAM, 1958-1985) (15 F)
Media in category "Maps of weather and climate in the 20th century"
The following 45 files are in this category, out of 45 total.
-
 NCDC temperature trend.png 2,005 × 991; 2.18 MB
-
 Earth Temperature.gif 640 × 480; 5.16 MB
-
 1935 base rev2.png 2,078 × 1,561; 481 KB
-
 Mapa globalnej temperatury2.jpg 800 × 596; 206 KB
-
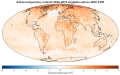 Mapa temperatury globalnej.svg 1,079 × 675; 687 KB
-
 Average Annual Tornado Reports.jpg 1,725 × 1,100; 483 KB
-
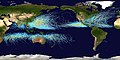
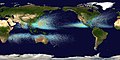 Global tropical cyclone tracks.jpg 8,000 × 4,000; 6.55 MB
-
 Nederland neerslag iso lijnen versie.png 707 × 900; 48 KB
-
 Nederland neerslag metingen.png 705 × 826; 37 KB
-
 Average Annual High Temperature of the United States.jpg 1,725 × 1,100; 318 KB
-
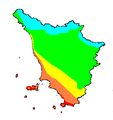 Eliofania assoluta media annua Toscana 1961-1990.PNG 378 × 402; 9 KB
-
 MeanMonthlyP.gif 1,200 × 744; 1.09 MB
-
 MonthlyMeanT.gif 550 × 340; 405 KB
-
 Precipitazioni medie Toscana 1961-1990.PNG 378 × 402; 10 KB
-
 United states average annual snowfall.jpg 1,725 × 1,100; 531 KB
-
 United States Cooling Degree Day map, 1961-1990.jpg 2,100 × 1,600; 474 KB
-
 United States Heating Degree Day map, 1961-1990.jpg 2,100 × 1,600; 644 KB
-
 NYrainfall.png 588 × 400; 150 KB
-
 Summer begins Sweden a.png 406 × 712; 38 KB
-
 Temp normal norway.jpg 400 × 800; 47 KB
-
 Mediterranean Drought Hoerlingetalfig1b.jpg 1,679 × 1,212; 965 KB
-
 Africa 1971 2000 mean temperature.png 1,082 × 1,183; 710 KB
-
 Africa 1971-2000 mean precipitation.png 1,082 × 1,183; 505 KB
-
 Spain precipitation.png 700 × 641; 163 KB
-
 Spain precipitation.svg 716 × 643; 329 KB
-
 Rr-ann zamg.png 1,242 × 759; 814 KB
-
 T-jan zamg.png 1,242 × 759; 784 KB
-
 T-jul zamg.png 1,242 × 759; 904 KB
-
 Olr 1979 1995 mean.png 1,213 × 715; 522 KB
-
 Max Air Temperature F for US County from 1979-2011.png 1,567 × 864; 200 KB
-
 NASA temperature trend.png 1,499 × 715; 936 KB
-
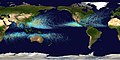
 Global tropical cyclone tracks-edit.jpg 8,000 × 4,000; 5.92 MB
-
 Global tropical cyclone tracks-edit2.jpg 8,000 × 4,000; 5.73 MB
-
 SolarGIS-Solar-map-Cyprus-tr.png 1,000 × 726; 379 KB
-
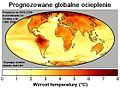 Prognoza świat.JPG 559 × 408; 45 KB
-
-
 AntarcticaTemps 1957-2006.jpg 720 × 480; 267 KB
-
 Greening Sahel 1982-1999.jpg 949 × 365; 64 KB
-
 Nevadas y heladas México.png 598 × 421; 15 KB
-
 North California Precipitations.gif 800 × 795; 50 KB
-
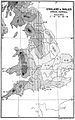 Rainfall in England and Wales, 1911.jpg 1,415 × 2,259; 366 KB
-
 Southern California Precipitations.gif 960 × 745; 32 KB
-
Summer temperatures Northern Hemisphere 1955 to 2011.ogv 31 s, 960 × 540; 2.45 MB
-
 Trend June max temp 1950 2009.svg 740 × 449; 1.76 MB
-
 Varmesum.jpg 516 × 606; 119 KB


.png)


